Difference between revisions of "Menu map view"
(→statistics measurements) |
(→statistics measurements) |
||
| Line 161: | Line 161: | ||
{|style="font-size:100% border-collapse:collapse"; text-align="left" border="0" cellspacing="0" cellpadding="10" | {|style="font-size:100% border-collapse:collapse"; text-align="left" border="0" cellspacing="0" cellpadding="10" | ||
|[[File:OpenCellID statistics cells.png]] | |[[File:OpenCellID statistics cells.png]] | ||
| − | || This option allows to generate a real time bar chart assorted by the number of | + | || This option allows to generate a real time bar chart assorted by the number of measurements.<br> |
<br> | <br> | ||
<u>The following sorting criteria can be used for the bar chart:</u> | <u>The following sorting criteria can be used for the bar chart:</u> | ||
<b>sorted by the total</b><br> | <b>sorted by the total</b><br> | ||
| − | shows the total number of | + | shows the total number of measurements per country stored in the database;<br> |
| − | the countries are sorted descending by the total of | + | the countries are sorted descending by the total of measurements per country |
<b>sorted by country name</b><br> | <b>sorted by country name</b><br> | ||
| − | shows the total number of | + | shows the total number of measurements per country stored in the database;<br> |
the countries are sorted alphabetically ascending by country name | the countries are sorted alphabetically ascending by country name | ||
<b>sorted by MCC</b><br> | <b>sorted by MCC</b><br> | ||
| − | shows the total number of | + | shows the total number of measurements per country stored in the database;<br> |
the countries are sorted ascending by [[Glossary#MCC_-_Mobile_Country_Code|MCC]] | the countries are sorted ascending by [[Glossary#MCC_-_Mobile_Country_Code|MCC]] | ||
| − | <b>new | + | <b>new measurements per day</b><br> |
| − | shows the number of | + | shows the number of newly added measurements per calender day;<br> |
the calender days are sorted descending (latest date on the left side of the bar chart) | the calender days are sorted descending (latest date on the left side of the bar chart) | ||
<br> | <br> | ||
| Line 185: | Line 185: | ||
<b>date from</b><br> | <b>date from</b><br> | ||
| − | all | + | all measurements added to the database after this day 0:00:00 UTC time will be used for the bar chart;<br> |
if this field is left empty, then today 0:00:00 will be chosen as default | if this field is left empty, then today 0:00:00 will be chosen as default | ||
<b>date to</b><br> | <b>date to</b><br> | ||
| − | all | + | all measurements added to the database before this day 23:59:29 UTC time will be used for the bar chart;<br> |
if this field is left empty, then today 23:59:59 will be chosen as default | if this field is left empty, then today 23:59:59 will be chosen as default | ||
<b>MCC</b><br> | <b>MCC</b><br> | ||
| − | if selected only | + | if selected only measurements will be shown of the selected country. |
<b>MNC</b><br> | <b>MNC</b><br> | ||
| − | if selected only | + | if selected only measurements will be shown of networks with the selected [[Glossary#MCC_-_Mobile_Country_Code|Mobile Country Code]] |
|} | |} | ||
|} | |} | ||
<br> | <br> | ||
<br> | <br> | ||
Revision as of 00:49, 20 January 2014
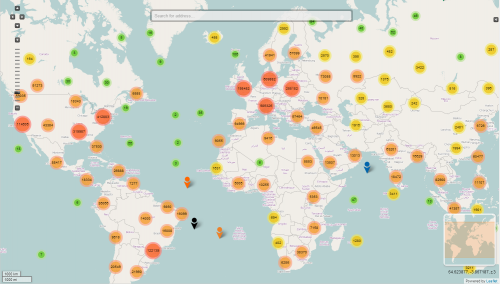
cell-id map

|
|


heat map

|
|


statistics cells

|
|

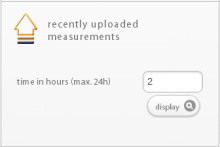
statistics measurements

|
|