Difference between revisions of "View the data"
From OpenCellID wiki
| Line 3: | Line 3: | ||
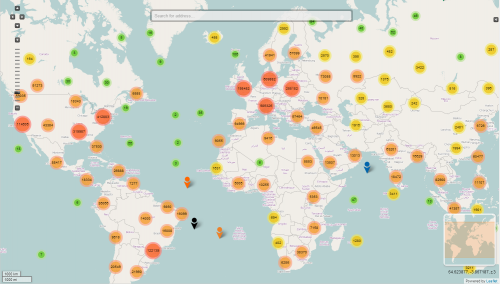
! scope="col" class="unsortable" width="550px" | Distribution of data in a selected area | ! scope="col" class="unsortable" width="550px" | Distribution of data in a selected area | ||
! scope="col" class="unsortable" width="20px" | | ! scope="col" class="unsortable" width="20px" | | ||
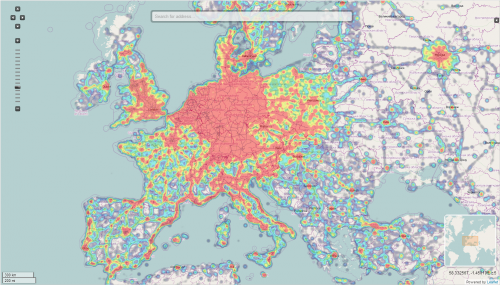
| − | ! scope="col" class="unsortable" width="550px" | | + | ! scope="col" class="unsortable" width="550px" | Heatmap |
|- | |- | ||
| align="center" title="Distribution of data in a selected area" | [[File:Opencellid statistics locations of cells.PNG|500px|link=What_is_OpenCellID]] | | align="center" title="Distribution of data in a selected area" | [[File:Opencellid statistics locations of cells.PNG|500px|link=What_is_OpenCellID]] | ||
| | | | ||
| − | | align="center" title=" | + | | align="center" title="Heatmap" | [[File:Opencellid statistics heatmap.png|500px|link=How_to_join]] |
|} | |} | ||
Revision as of 00:35, 19 January 2014
| Distribution of data in a selected area | Heatmap | |
|---|---|---|
|
|
| Screenshot-1 | Screenshot-2 | |
|---|---|---|
|
|