Difference between revisions of "View the data"
From OpenCellID wiki
| Line 1: | Line 1: | ||
{| <!--TTTtable--> class="wikitable sortable" text-align: left;" width=998px | {| <!--TTTtable--> class="wikitable sortable" text-align: left;" width=998px | ||
|- | |- | ||
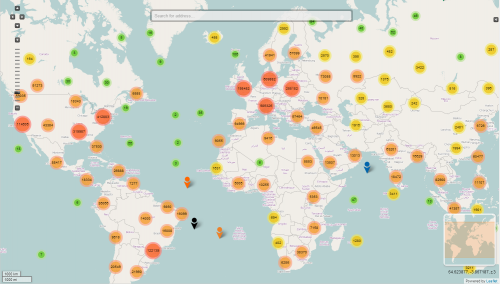
| − | ! scope="col" class="unsortable" width="550px | + | ! scope="col" class="unsortable" width="550px"| Distribution of data in a selected area |
! scope="col" class="unsortable" width="20px" | | ! scope="col" class="unsortable" width="20px" | | ||
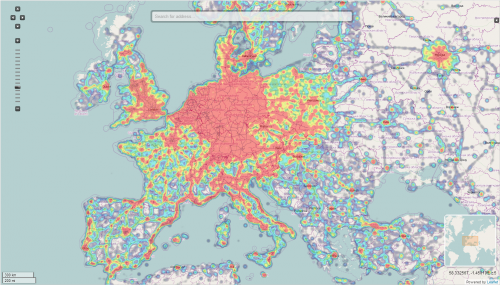
! scope="col" class="unsortable" width="550px" | Heatmap | ! scope="col" class="unsortable" width="550px" | Heatmap | ||
Revision as of 01:10, 19 January 2014
| Distribution of data in a selected area | Heatmap | |
|---|---|---|
|
| |
| bla | bla |
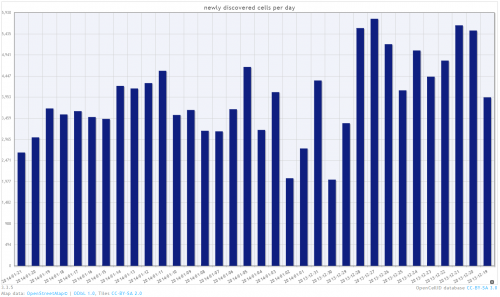
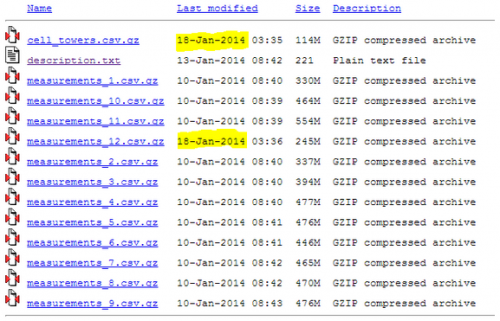
| Bar charts | Raw data download | |
|---|---|---|
|
| |
| bla | bla |