Difference between revisions of "View the data"
From OpenCellID wiki
(Mention http://opencellid.org/) |
|||
| (38 intermediate revisions by 2 users not shown) | |||
| Line 1: | Line 1: | ||
| − | {| <!--TTTtable--> class="wikitable sortable" style="font-size: | + | On http://opencellid.org/ one can see: |
| + | |||
| + | {| <!--TTTtable--> class="wikitable sortable" style="font-size: 150%; text-align: left;" width=998px | ||
|- | |- | ||
| − | ! scope="col" class="unsortable" width="550px"| Distribution of data in a selected area | + | ! scope="col" class="unsortable" width="550px"| [[Menu_map_view|Distribution of data in a selected area]] |
! scope="col" class="unsortable" width="20px" | | ! scope="col" class="unsortable" width="20px" | | ||
| − | ! scope="col" class="unsortable" width="550px" | | + | ! scope="col" class="unsortable" width="550px" | [[Menu_map_view#heat_map|Heat map]] |
|- style="font-size=1" | |- style="font-size=1" | ||
| − | | align="center" title="Distribution of data in a selected area" | [[File:Opencellid statistics locations of cells.PNG|500px|link= | + | | align="center" title="Distribution of data in a selected area" | [[File:Opencellid statistics locations of cells.PNG|500px|link=http://opencellid.org/#&action=filters.recentlyUploadedBaseStationMeasurements&time=24]] |
| | | | ||
| − | | align="center" title="Heatmap" | [[File:Opencellid statistics heatmap.png|500px|link= | + | | align="center" title="Heatmap" | [[File:Opencellid statistics heatmap.png|500px|link=http://opencellid.org/#&action=heatMaps.dailyHeatmap]] |
| − | |- style="font-size: | + | |- style="font-size: 65%;" |
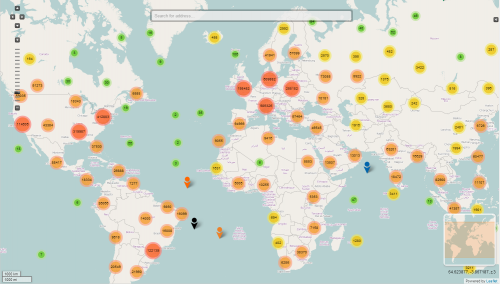
| − | | align=" | + | | align="left" title="Distribution of data in a selected area" | This map view allows you to zoom in and pan the map to the area you are interested in. |
| + | |||
| + | Details regarding the various filtering options can be found <u>[[Menu_map_view#map_filter_options|here]]</u>. | ||
| | | | ||
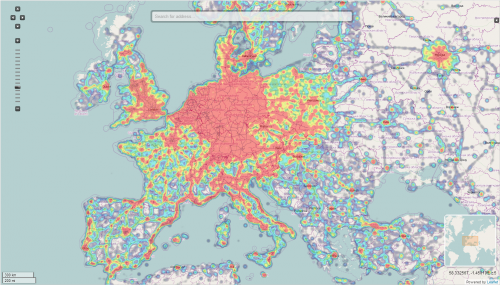
| − | | align=" | + | | align="left" title="Heat map" | The heat map is generated in real time and shows the density of measurements in the database in each area.<br> There is also a <u>[http://opencellid.org/#&action=heatMaps.heatmapMovie daily updated heat map movie]</u>, that shows when and where the data was contributed over time. |
| + | |||
| + | Details regarding heat maps can be found <u>[[Menu_map_view#heat_map|here]]</u>. | ||
|} | |} | ||
<br> | <br> | ||
| − | {| <!--TTTtable--> class="wikitable sortable" style="font-size: | + | {| <!--TTTtable--> class="wikitable sortable" style="font-size: 150%; text-align: left;" width=998px |
|- | |- | ||
| − | ! scope="col" class="unsortable" width="550px" | Bar charts | + | ! scope="col" class="unsortable" width="550px" | [[Menu_map_view#statistics_cells|Bar charts]] |
! scope="col" class="unsortable" width="20px" | | ! scope="col" class="unsortable" width="20px" | | ||
| − | ! scope="col" class="unsortable" width="550px" | Raw data download | + | ! scope="col" class="unsortable" width="550px" | [[Menu_map_view#database|Raw data download]] |
| − | |- | + | |- style="font-size=1" |
| − | | align="center" title="Bar charts" | [[File:Opencellid statistics bar chart.png|500px|link= | + | | align="center" title="Bar charts" | [[File:Opencellid statistics bar chart.png|500px|link=http://opencellid.org/#&action=statistics.cells&sortByRadio=4&dateFrom=&dateTo=&mcc=&mnc=]] |
| | | | ||
| − | | align="center" title="Raw data download" | [[File:Opencellid database download.png|500px|link= | + | | align="center" title="Raw data download" | [[File:Opencellid database download.png|500px|link=http://opencellid.org/downloads/]] |
| − | |- | + | |- style="font-size: 65%;" |
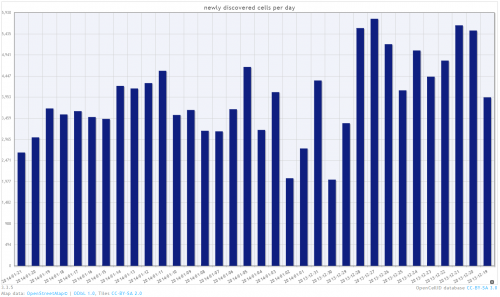
| − | | align=" | + | | align="left" title="Bar charts" | Bar charts can be displayed for selected regions, time frames, networks and more.<br>All bar charts are generated in real time. |
| + | |||
| + | Details regarding bar chart statistics can be found <u>[[Menu_map_view#statistics_cells|here]]</u>. | ||
| | | | ||
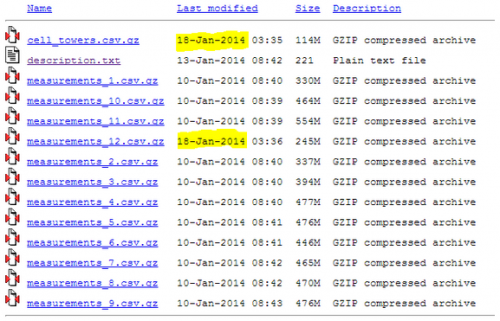
| − | | align=" | + | | align="left" title="Raw data download" | OpenCellID is an opensource project.<br>The entire data collected by the community can be <u>[http://opencellid.org/downloads/ downloaded here]</u> or requested through the <u>[[API|OpenCellID API]]</u>. |
|} | |} | ||
Latest revision as of 10:32, 2 March 2015
On http://opencellid.org/ one can see:
| Distribution of data in a selected area | Heat map | |
|---|---|---|
|
| |
| This map view allows you to zoom in and pan the map to the area you are interested in.
Details regarding the various filtering options can be found here. |
The heat map is generated in real time and shows the density of measurements in the database in each area. There is also a daily updated heat map movie, that shows when and where the data was contributed over time. Details regarding heat maps can be found here. |
| Bar charts | Raw data download | |
|---|---|---|
|
| |
| Bar charts can be displayed for selected regions, time frames, networks and more. All bar charts are generated in real time. Details regarding bar chart statistics can be found here. |
OpenCellID is an opensource project. The entire data collected by the community can be downloaded here or requested through the OpenCellID API. |