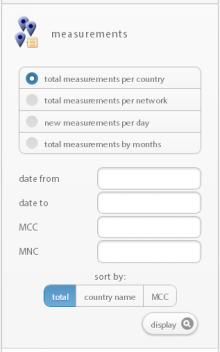
This option allows you to generate a real-time bar chart assorted by the number of measurements.
The following sorting criteria can be used for the bar chart:
total per country
This shows the total number of measurements per country stored in the database;
the countries are sorted descending by the total of measurements per country, country name or MCC (latest date on the left side of the bar chart).
total per network
This shows the total number of measurements per network stored in the database;
the networks are sorted descending by the total number of measurements per network (latest date on the left side of the bar chart).
new measurements per day
This shows the number of newly discovered cells per calender day;
the calender days are sorted descending (latest date on the left side of the bar chart).
total measurements per month
This shows the total number of measurements per calender month;
the calender months are sorted descending (latest date on the right side of the bar chart).
The following filter criteria can be used for the bar chart:
date from
All measurements added to the database after the specified day at 0:00:00 UTC time will be used for the bar chart;
if this field is left empty, today's date at 0:00:00 will be chosen by default.
date to
All measurements added to the database before the specified day until 23:59:29 UTC time will be used for the bar chart;
if this field is left empty, today's date until 23:59:59 will be chosen by default.
MCC
If selected, only measurements of the selected country will be displayed.
MNC
If selected, only measurements of networks with the selected Mobile Country Code will be displayed.
| 