Difference between revisions of "Menu map view"
(→heat map) |
(→heat map) |
||
| Line 86: | Line 86: | ||
{|style="font-size:100% border-collapse:collapse"; text-align="left" border="0" cellspacing="0" cellpadding="10" | {|style="font-size:100% border-collapse:collapse"; text-align="left" border="0" cellspacing="0" cellpadding="10" | ||
|[[File:OpenCellID daily heat map.png]] | |[[File:OpenCellID daily heat map.png]] | ||
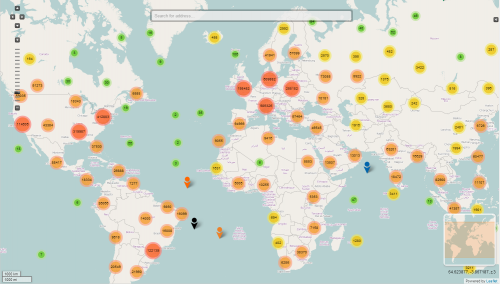
| − | || This menu option allows to to display the latest heat map. The heat map indicates the density of unique base stations world wide. | + | || This menu option allows to to display the latest heat map. The heat map indicates the density of unique base stations world wide. |
| − | *Red areas have a high density of known cell towers. | + | *Red areas have a high density of known cell towers. |
| − | *Yellow areas have a reasonable density of known cell towers. | + | *Yellow areas have a reasonable density of known cell towers. |
| − | *Blue and grea areas have a low density of known cell towers. | + | *Blue and grea areas have a low density of known cell towers. |
*For areas which are not colored so far no cell towers have been recorded. | *For areas which are not colored so far no cell towers have been recorded. | ||
Revision as of 22:38, 19 January 2014
cell-id map

|
|


heat map

|
|

