Difference between revisions of "Menu map view"
(→statistics cells) |
(→statistics cells) |
||
| Line 116: | Line 116: | ||
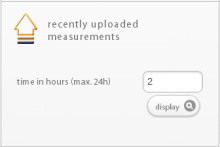
|| This option allows to generate a real time bar chart assorted by the number of cells. | || This option allows to generate a real time bar chart assorted by the number of cells. | ||
| − | The following sorting criteria can be used for the bar chart: | + | <u>The following sorting criteria can be used for the bar chart:</u> |
<b>sorted by the total</b><br> | <b>sorted by the total</b><br> | ||
| Line 135: | Line 135: | ||
<br> | <br> | ||
<br> | <br> | ||
| − | The following filter criteria can be used for the bar chart: | + | <u>The following filter criteria can be used for the bar chart:</u> |
<b>date from</b><br> | <b>date from</b><br> | ||
Revision as of 00:37, 20 January 2014
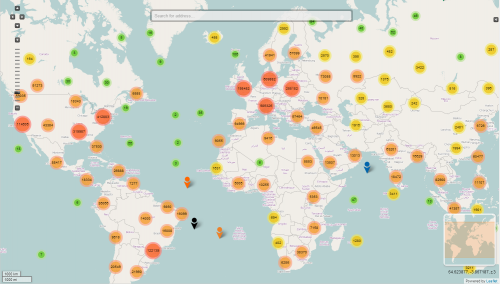
cell-id map

|
|


heat map

|
|


statistics cells

|
|
