Difference between revisions of "Menu map view"
(→map view) |
|||
| Line 6: | Line 6: | ||
{| <!--TTTtable--> class="wikitable sortable" style="font-size: 150%; text-align: left;" width=998px | {| <!--TTTtable--> class="wikitable sortable" style="font-size: 150%; text-align: left;" width=998px | ||
|- | |- | ||
| − | ! scope="col" class="unsortable" width="550px"| | + | ! scope="col" class="unsortable" width="550px"| map view representation |
! scope="col" class="unsortable" width="20px" | | ! scope="col" class="unsortable" width="20px" | | ||
! scope="col" class="unsortable" width="550px" | Heat map | ! scope="col" class="unsortable" width="550px" | Heat map | ||
|- style="font-size=1" | |- style="font-size=1" | ||
| − | | align="center" title=" | + | | align="center" title="map view representation" | [[File:OpenCellID_many_cells_in_one_place.png|500px|link=http://opencellid.org/#&action=filters.recentlyUploadedBaseStationMeasurements&time=24]] |
| | | | ||
| − | | align="center" title="Heatmap" | [[File:Opencellid statistics heatmap.png|500px | + | | align="center" title="Heatmap" | [[File:Opencellid statistics heatmap.png|500px]] |
|- style="font-size: 65%;" | |- style="font-size: 65%;" | ||
| align="left" title="Distribution of data in a selected area" | This map view allows to zoom in and to pan the map to the area you are interested in. | | align="left" title="Distribution of data in a selected area" | This map view allows to zoom in and to pan the map to the area you are interested in. | ||
| Line 36: | Line 36: | ||
........ | ........ | ||
| + | |||
===map filter options=== | ===map filter options=== | ||
Revision as of 23:59, 22 January 2014
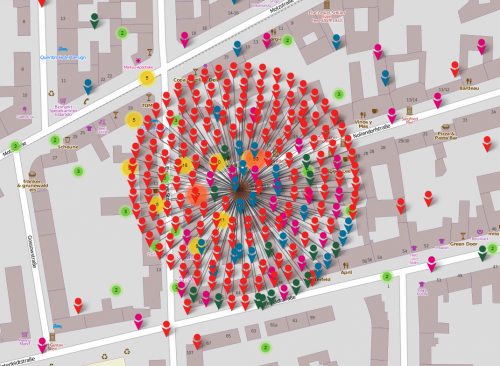
map view
| map view representation | Heat map | |
|---|---|---|
|

| |
| This map view allows to zoom in and to pan the map to the area you are interested in.
Details regarding the various filtering options can be found here. |
The heat map is generated in real time and shows the density of measurements in the database in each area. There is also a daily updated heat map movie, that shows when and where the data was contributed over time. |
........
map filter options

|
|


heat map

|
|


statistics cells

|
|

statistics measurements

|
|

search location

|
|


database

|
|


