Difference between revisions of "View the data"
From OpenCellID wiki
| Line 13: | Line 13: | ||
Details regarding the various filtering options can be found <u>[[Menu_map_view|here]]</u>. | Details regarding the various filtering options can be found <u>[[Menu_map_view|here]]</u>. | ||
| | | | ||
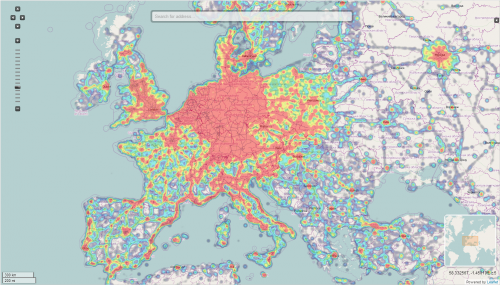
| − | | align="left" title="Heatmap" | The heat map is generated | + | | align="left" title="Heatmap" | The heat map is generated in real time and shows the density of measurements in the database in each area.<br> There is also a daily updated heatmap movie, that shows when and where the data was contributed over time. |
|} | |} | ||
<br> | <br> | ||
Revision as of 16:37, 20 January 2014
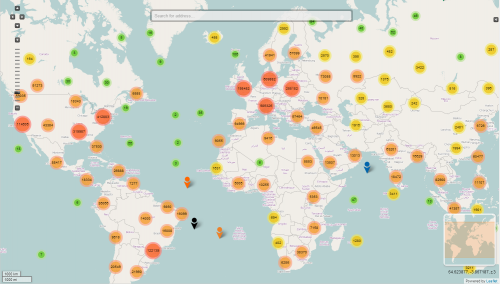
| Distribution of data in a selected area | Heatmap | |
|---|---|---|
|
| |
| This map view allows to zoom in and to pan the map to the area you are interested in.
Details regarding the various filtering options can be found here. |
The heat map is generated in real time and shows the density of measurements in the database in each area. There is also a daily updated heatmap movie, that shows when and where the data was contributed over time. |
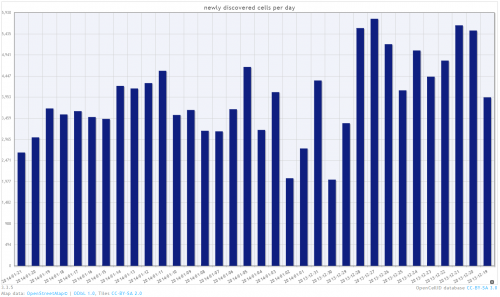
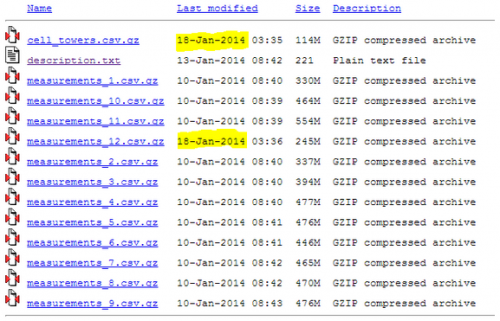
| Bar charts | Raw data download | |
|---|---|---|
|
| |
| bla | bla |