Difference between revisions of "View the data"
From OpenCellID wiki
| Line 7: | Line 7: | ||
| align="center" title="Distribution of data in a selected area" | [[File:Opencellid statistics locations of cells.PNG|500px|link=http://opencellid.org/#&action=filters.recentlyUploadedBaseStationMeasurements&time=24]] | | align="center" title="Distribution of data in a selected area" | [[File:Opencellid statistics locations of cells.PNG|500px|link=http://opencellid.org/#&action=filters.recentlyUploadedBaseStationMeasurements&time=24]] | ||
| | | | ||
| − | | align="center" title="Heatmap" | [[File:Opencellid statistics heatmap.png|500px|link= | + | | align="center" title="Heatmap" | [[File:Opencellid statistics heatmap.png|500px|link=http://opencellid.org/#&action=heatMaps.dailyHeatmap]] |
|- style="font-size: 65%;" | |- style="font-size: 65%;" | ||
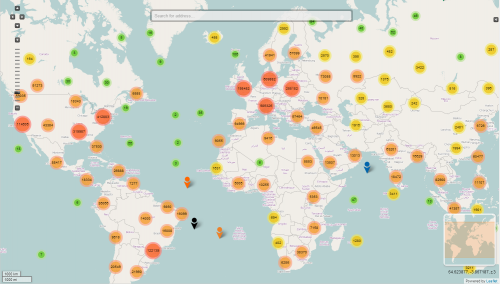
| align="left" title="Distribution of data in a selected area" | This map view allows to zoom in and to pan the map to the area you are interested in. | | align="left" title="Distribution of data in a selected area" | This map view allows to zoom in and to pan the map to the area you are interested in. | ||
Revision as of 00:21, 22 January 2014
| Distribution of data in a selected area | Heat map | |
|---|---|---|
|
| |
| This map view allows to zoom in and to pan the map to the area you are interested in.
Details regarding the various filtering options can be found here. |
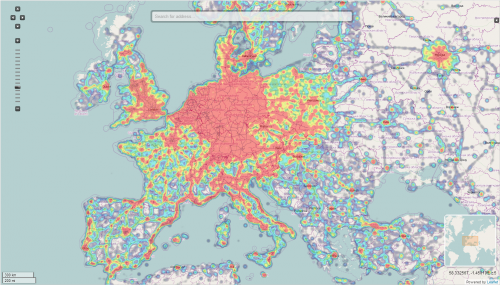
The heat map is generated in real time and shows the density of measurements in the database in each area. There is also a daily updated heat map movie, that shows when and where the data was contributed over time. |
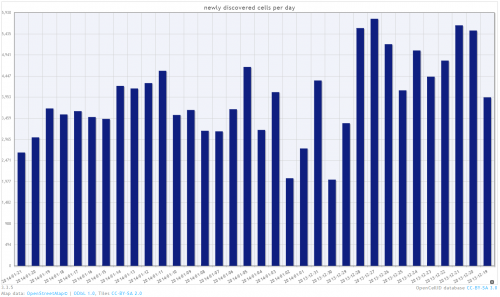
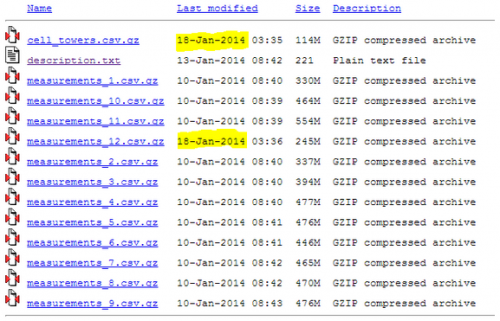
| Bar charts | Raw data download | |
|---|---|---|
|
| |
| Bar charts can be displayed for selected regions, time frames, networks and many more. All bar charts are generated in real time. |
OpenCellID is an opensource project. The data collected by the community can be downloaded in total or can be requested through the OpenCellID API. |