View the data
From OpenCellID wiki
On http://opencellid.org/ one can see:
| Distribution of data in a selected area | Heat map | |
|---|---|---|
|
| |
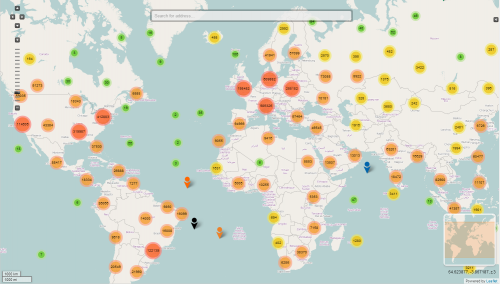
| This map view allows you to zoom in and pan the map to the area you are interested in.
Details regarding the various filtering options can be found here. |
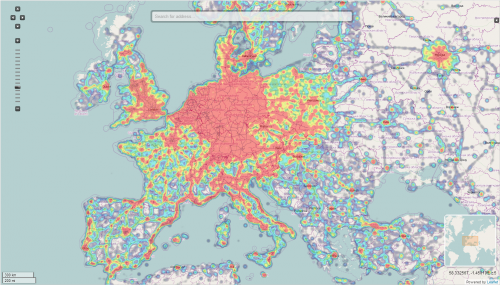
The heat map is generated in real time and shows the density of measurements in the database in each area. There is also a daily updated heat map movie, that shows when and where the data was contributed over time. Details regarding heat maps can be found here. |
| Bar charts | Raw data download | |
|---|---|---|
|
| |
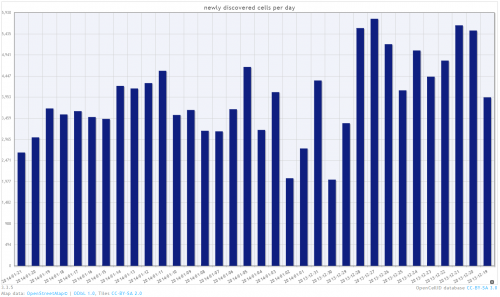
| Bar charts can be displayed for selected regions, time frames, networks and more. All bar charts are generated in real time. Details regarding bar chart statistics can be found here. |
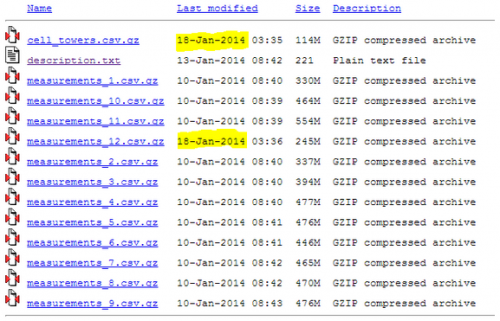
OpenCellID is an opensource project. The entire data collected by the community can be downloaded here or requested through the OpenCellID API. |